The claim is true up until the 1930s. But data show that Northern Ireland has run a fiscal deficit since 1966. The most recent figure, from 2013-14, is a subvention of £9.2 billion.
The UUP’s 2016 manifesto states: “There was a time when we were net contributors to Her Majesty’s Treasury, now Stormont is dependent on an annual £11 billion subvention from Westminster every year.”
This claim is based off Professor Bob Rowthorn’s research, which describes how when Northern Ireland was created it was seen as “an integral and self-supporting component of Britain’s Imperial system”, generating a fiscal surplus. Thus a regular “Imperial Contribution” was paid by the province, until the economic crises of the 1930s.
Northern Ireland residents pay taxes directly to the UK Government. The UK Government then allocates the funding to its departments and the devolved administrations. The taxes generated within Northern Ireland are considerably less than the level of funding received from HM Treasury — the shortfall made up by a subvention.
Figures published by Ulster University’s Conflict Archive on the Internet (CAIN) show how subvention rose from the period of 1966-1993. Subvention was first recorded as costing £52 million annually (£489 million in 1992 prices), rising to £3.34 billion by 1996-97.
Further figures are provided by the Net Fiscal Balance report, produced by the Department of Finance (UK). The latest estimate, for 2013-14, is a fiscal deficit of £9.2 billion.
HM Treasury is responsible for managing and implementing UK fiscal and macroeconomic policy, as well as determining public expenditure allocations across the UK regions. As a result, Northern Ireland’s Budget, along with that for Scotland and Wales, continues to be determined within the framework of public expenditure control in the UK.
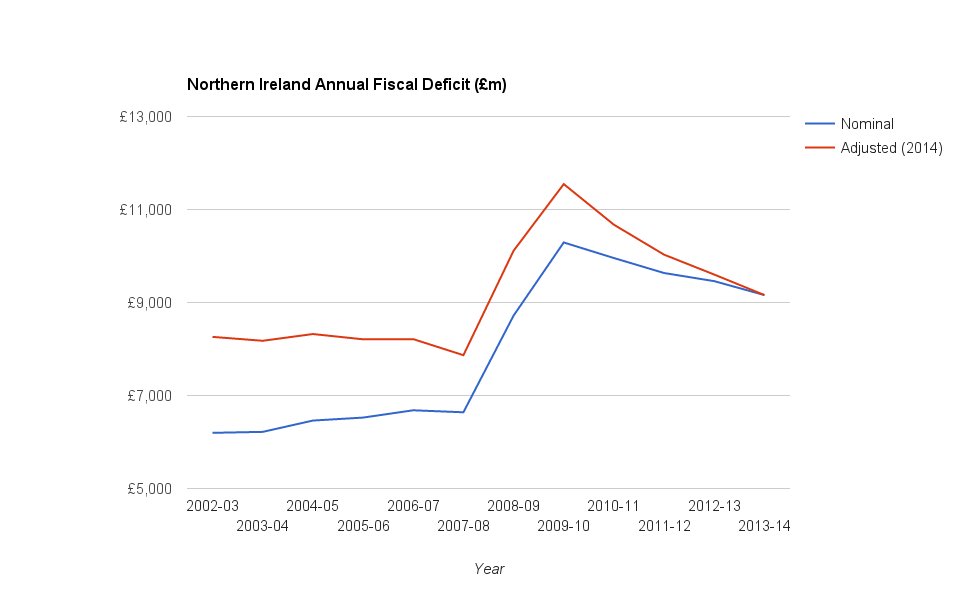
Northern Ireland Annual Fiscal Deficit (£m)
| Year | Nominal | Adjusted (2014£) |
|---|---|---|
| 1966-67 | £52 | £973 |
| 1967-68 | £63 | £1,149 |
| 1968-69 | £74 | £1,284 |
| 1969-70 | £74 | £1,217 |
| 1970-71 | £88 | £1,355 |
| 1971-72 | £126 | £1,758 |
| 1972-73 | £181 | £2,346 |
| 1973-74 | £312 | £3,671 |
| 1974-75 | £389 | £3,845 |
| 1975-76 | £565 | £4,233 |
| 1976-77 | £620 | £3,879 |
| 1977-78 | £688 | £3,624 |
| 1978-79 | £848 | £4,096 |
| 1979-80 | £944 | £3,949 |
| 1980-81 | £1,090 | £3,739 |
| 1981-82 | £1,064 | £3,215 |
| 1982-83 | £1,149 | £3,174 |
| 1983-84 | £1,305 | £3,439 |
| 1984-85 | £1,489 | £3,727 |
| 1985-86 | £1,536 | £3,611 |
| 1986-87 | £1,593 | £3,618 |
| 1987-88 | £1,570 | £3,415 |
| 1988-89 | £1,698 | £3,513 |
| 1989-90 | £1,757 | £3,445 |
| 1990-91 | £2,018 | £3,681 |
| 1991-92 | £2,436 | £4,110 |
| 1992-93 | £3,296 | £5,320 |
| 1993-94 | £3,505 | £5,517 |
| 1994-95 | £2,895 | £4,467 |
| 1995-96 | £3,340 | £5,020 |
| – | ||
| 2002-03 | £6,197 | £8,261 |
| 2003-04 | £6,218 | £8,177 |
| 2004-05 | £6,461 | £8,322 |
| 2005-06 | £6,525 | £8,208 |
| 2006-07 | £6,682 | £8,212 |
| 2007-08 | £6,639 | £7,867 |
| 2008-09 | £8,718 | £10,113 |
| 2009-10 | £10,291 | £11,547 |
| 2010-11 | £9,956 | £10,673 |
| 2011-12 | £9,634 | £10,029 |
| 2012-13 | £9,459 | £9,601 |
| 2013-14 | £9,160 | £9,160 |
Source: Net Fiscal Balance reports (Department of Finance (UK)).
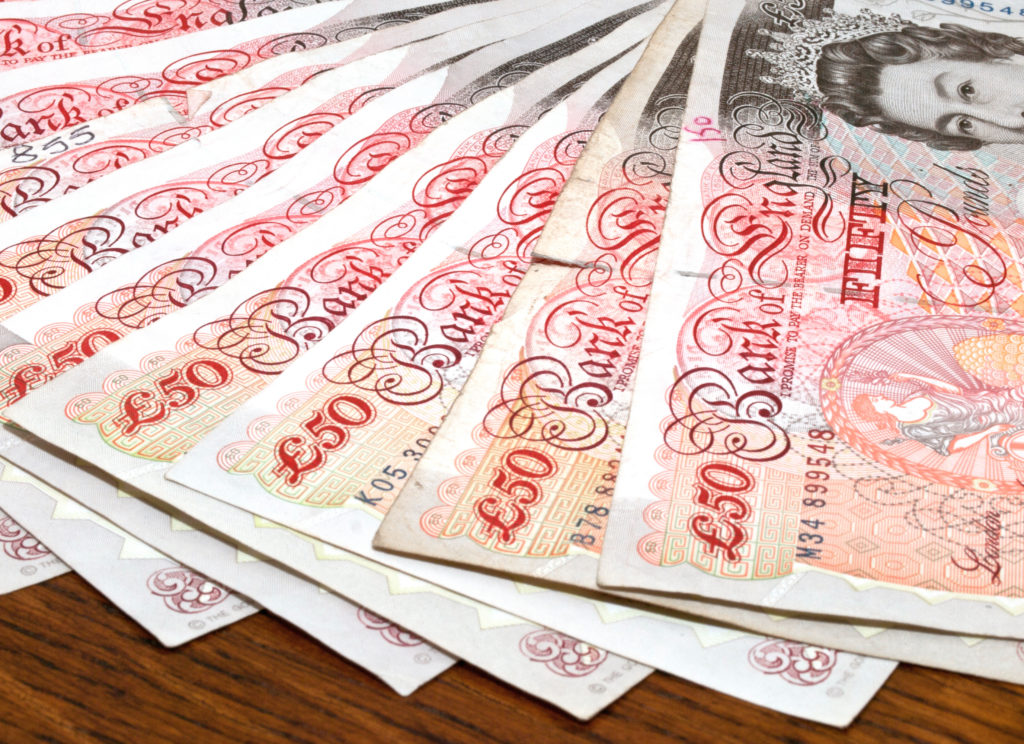
Image: “Fifties” by William Warby is licensed by CC BY 2.0
FactCheckNI is Northern Ireland’s first and only dedicated independent fact-checking service and a verified signatory to the International Fact-Checking Network’s Code of Principles. You can learn more about about FactCheckNI, our personnel, what our article verdicts mean, and how to submit a claim.