- The North East of England consistently has lower wages than Northern Ireland, though NI has the lowest pay if just compared to England as a whole along with Scotland and Wales. Wages here are likely to be lower than in Ireland, although up-to-date comparisons are difficult.
- Comparing economic growth across the UK and Ireland is difficult due to the number of different measures used. There is some evidence that NI has the lowest growth – but other data suggests Wales’ growth is the lowest.
- Northern Ireland definitely has the lowest productivity and the highest economic inactivity across the UK and Ireland.
In its manifesto published ahead of the 2023 local government elections, Sinn Fein claimed:
“The north has the lowest wages, lowest economic growth, lowest productivity, and highest economic inactivity on these islands”
Comparing the economic performance of different parts of the UK and Ireland is complicated, for several reasons:
- underlying data is not always directly comparable between different parts of the UK – and this is even more true when comparing the UK with Ireland; and
- the accuracy of these claims can change depending on whether the UK is analysed as four nations or as 12 regions (meaning NI, Scotland, Wales, and the nine regions of England).
So, strap yourself in for a journey through reams of economic statistics – from the Northern Ireland Statistics and Research Agency (NISRA), the Office for National Statistics (ONS), Ireland’s Central Statistics Office (CSO), the Organisation for Economic Cooperation and Development (OECD) and more – and some analysis of how to compare them.
WARNING: You might want coffee.
[Please note: Sinn Féin did not reply to our request for them to share their data sources.]
[UPDATE: Following publication, Sinn Féin provided shared data sources for their claims. The fact check and verdict remain unchanged.]
- Wages
There is more than one way to measure “average” wages. The Office for National Statistics (ONS) prefers to use median gross weekly earnings as its measure of average earnings because it is less affected than the mean average by a relatively small number of very high earners.
According to the latest figures (median gross weekly pay in 2022 for full-time employees) across the 12 regions of the UK, Northern Ireland had the third lowest pay (£592), ahead of the North East of England (£575) and Yorkshire and the Humber (£579). The UK average was £640.
The North East has had the lowest median weekly pay every year since 2018. Northern Ireland was second lowest in 2019 and 2020, but was middle of the table in 2021.
However, if this comparison is made only between the four nations of the UK, rather than all the UK regions, then NI has the lowest wages according to the latest figures (for 2022).
Wales had lower average wages than Northern Ireland in 2021. In comparisons between England, Scotland Wales and NI over the past decade, Northern Ireland has had the lowest average wage in six of those years and Wales the lowest for the other four.
What about wages in Ireland? The Central Statistics Office’s (CSO) latest report on Earnings and Labour Costs says that average weekly earnings were €900.26 in Q4 2022 (preliminary figures), which is around £780 in Sterling. However, that figure isn’t directly comparable with the UK ones above as it’s the mean rather than the median.
A better comparison is found in figures published a few days ago, when CSO released median weekly earnings figures for 2021: €644.55 – which is around £550-575 using historic exchange rates. Northern Ireland’s figure was £575 for this period.
That figure for Ireland represents an increase of 2.4% on 2020’s figure (€629.46). There is a huge health warning about making comparisons from that year due to earnings being affected by the pandemic and income support schemes. However, there’s nothing yet comparable for 2022.
Looking more widely for an international comparison, the OECD reported that Irish earnings in 2021 (51.0k USD) were on a par with UK earnings (50.0k USD). As average UK earnings are higher than average pay in NI, this would indicate that pay here is lower than in Ireland … however, the OECD analysis uses mean average rather than median.
In general, comparisons between NI and Ireland are trickier than between NI and other parts of the UK, because the statistical basis is different. Comparing median weekly earnings for 2021 (the last year for which Ireland has published relevant figures) and using contemporaneous data exchange rates might suggest NI wages were higher than in Ireland, but those figures are from the height of the pandemic and could be distorted by furlough and other public support schemes. Meanwhile, the OECD figures above suggest wages in Ireland are significantly higher than in NI.
Where does all this leave the claim?
When considering the UK as a dozen regions, the claim is inaccurate because the North East of England has consistently had lower average wages than NI, including in the latest figures.
However, when considering the UK as four nations, things are different. NI has had the lowest average pay in the UK in six of the past ten years, including in the latest figures. Together with the OECD figures comparing average wages in the UK with those in Ireland, this less granular approach is backed by evidence.
- Economic growth
Economic growth is measured as the (annual) percentage change of the inflation-adjusted market value of the goods and services produced by an economy in a financial year. It’s conventionally expressed as the rate of increase in the real Gross Domestic Product (GDP).
ONS figures released last month provide a regionalised breakdown of the annual growth in real GDP for 2020 and 2021. Both those years are atypical by recent standards of GDP growth in western Europe. The pandemic had a huge impact.
In 2020, all 12 UK regions of the UK showed decline (i.e. negative annual growth). Northern Ireland had the third highest growth (-11.2%), behind East Midlands (-10.6%) and South East (-11.0%). The North East of England had the lowest annual growth (-13.3%).
Looking solely across the four nations, Northern Ireland was in top position with the smallest decline (-11.2%), followed by England and Wales (both on -11.5%) and then Scotland (-11.8%).
The 2021 figures (which are currently estimates) show that all regions had returned to positive growth. Northern Ireland had an annual growth of 9.0%, near the middle of the table for the 12 regions. It was ahead of both Scotland, which had the lowest growth (7.5%), and London (8.5%).
Just looking at the four nations, NI (9.0%) was sandwiched between Wales (9.1%) and England (8.9%), all well above Scotland (7.5%).
Because of the impact of COVID-19, those years are unusual, however it is clear that the official figures for that period do not support the claim that NI has the lowest economic growth in the UK, let alone the UK and Ireland. What about more recent figures?
Seasonally adjusted quarter-on-quarter GDP growth for the 12 regions of the UK shows that Northern Ireland’s quarter-on-quarter growth (0.5%) in Q1 2022 was marginally below the UK average (0.6%), half of London (1%) which came top, and well above Wales which was bottom with negative growth of -0.3%.
Like many of the UK regions, Northern Ireland experienced negative growth in Q2 2022 (-0.3%), below the UK average (0.1%). London was top with 1.2% growth, and the North East of England was bottom on -1.6%.
Just looking at the four nations of the UK, Wales had the lowest quarter-on-quarter GDP growth of the four nations for the last two quarters reported (Q1 2022 and Q2 2022). Northern Ireland was second lowest for both quarters.
ONS also published seasonally adjusted quarter-to-same-quarter-last-year GDP growth figures. NI is third lowest in terms of growth between Q1 2021 and Q2 2022. It’s sixth out of 12 regions for Q2 2021 to Q2 2022, below the UK average in both timeframes. Just considering the four nations, NI had the lowest growth in Q1 2021-Q1 2022, and second lowest in Q2 2021-Q2 2022.
These results do not back the claim that NI has the lowest economic growth in the UK at a regional level. When considering the four nations, there are parts of the figures that indicate Wales is lowest and parts that suggest NI – although probably more evidence for the former.
However, nothing is simple and GDP is not the only measure of economic growth.
The Northern Ireland Statistics and Research Agency (NISRA) produces its own measure of growth in NI. The NI Composite Economic Index (NICEI) is an experimental quarterly measure of the performance of the NI economy, based on available official statistics from various jurisdictions. However, NICEI figures are produced for Northern Ireland only. They are therefore valuable for tracking the local economy over time but of limited use in comparisons with other regions or countries.
The ONS has also produced model-based estimates of regional GVA. ONS last published regional data in June 2022 representing Q1 2022 growth. The experimental model is undergoing evaluation and there have been no further updates. The Q1 2022 growth found that Northern Ireland had the lowest growth (0.4%) of all UK regions, below West Midlands (0.5%), Scotland (0.7%). At the top of the table, London has 1.2% growth ahead of Wales (1.0%). Note that this is based on data that is more than a year old.
This provides some indication that NI had the lowest growth of any UK region, but that is based on data for one three-month period (Q1 2022) and uses a model that was described as experimental and for which the ONS has provided no new data in almost a year.
How about comparisons with Ireland?
The latest European Commission report on real GDP in Ireland says it grew year-on-year by 12.0% in 2022.
Eurostat shows a real GDP growth rate in Ireland of 12.0% in 2022 (and 13.6% in 2021).
With such a variety of different measures (GDP, GVA, and GNI that we’ll explain in the next section), each with their own foibles and challenges (regional figures are more difficult to calculate than country-wide ones), comparisons across regions of the UK and Ireland are difficult to make.
Using a patchwork of sources, NI had high GDP growth in 2021 and just below average growth (quarter-on-quarter) within the UK for Q1 2022 with Wales reporting much lower growth. Model-based regional GVA growth for Q1 2022 tells a different story with NI at the bottom of the table.
By some measures, NI has experienced periods when it had lowest measured growth in the UK and probably below Irish figures. However, once again, it depends which measure is used and the low growth isn’t sustained. It could equally well be argued that Wales has the lowest growth in the UK.
Does NI have the lowest growth in the UK and Ireland? That cannot be ruled out, but there is no conclusive evidence that this is true.
- Productivity
Productivity measures the value of output produced in the economy for a given amount of work.
The latest figures from ONS for regions across the UK are for 2020. Using GVA (the value of an industry’s outputs less the value of intermediate inputs used in the production process) as a proxy for GDP, Northern Ireland has the lowest output per hour, closely followed by Wales. London has the highest output per hour. Analysts note that furlough affected the number of hours people worked. However, NI has nearly always been the least productive region of the UK over the last two decades.
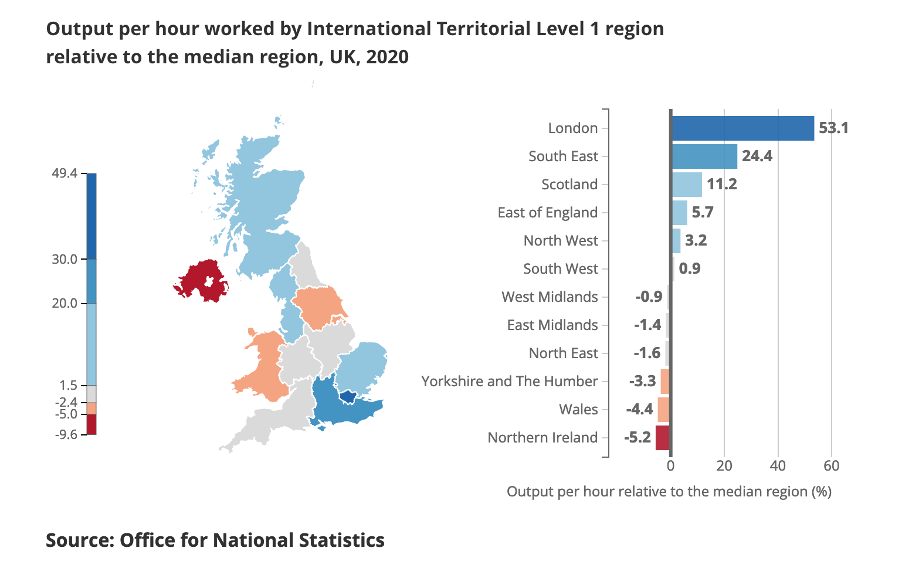
ONS notes that if the alternative output per job measure is used (which takes account of the average hour worked per job varying across regions, and reflects different part-time and full-time working patterns), then “Northern Ireland performs noticeably stronger on this metric, where it is above the UK median, than it does using the output per hour measure”. This is also consistent historically.
Productivity in the UK and Ireland can be compared using the OECD’s productivity statistics which are reported in US$, and balances to allow the best-possible comparisons.
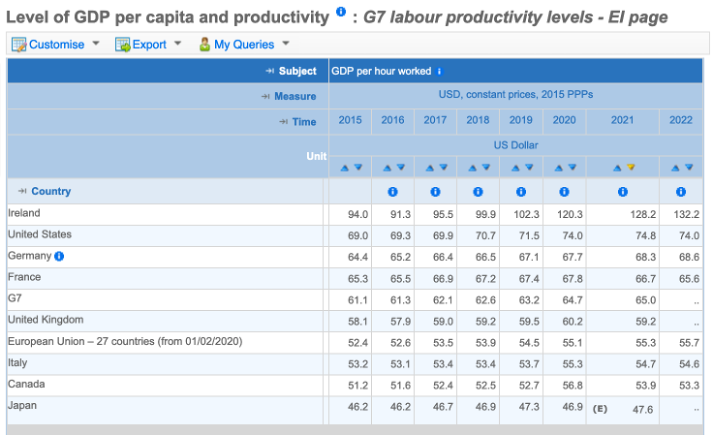
Using the 2021 figures, the UK’s GDP per hour is $59.2, above the EU27 average ($55.3) but well behind Germany ($68.3) and France ($66.7). Ireland’s productivity is reported to be a massive £128.2 (rising to $132.2 in 2022), around double that of the UK. However, Ireland’s GDP is widely understood to be skewed since “a lot of [its] GDP includes profits that are generated [in Ireland] but then go straight out to the owners of companies abroad”. The CSO also produces a Modified Gross National Income (GNI) which measures the size of the Irish economy by excluding globalisation effects of multi-national companies headquartered in the country.
Researchers at Queen’s University Belfast used the GNI figure to determine that in 2020, Irish productivity was around 29% higher than the UK.
So how does Northern Ireland compare to Ireland? The Economic & Social Research Institute (ESRI) answered this question in their November 2022 report on Modelling Productivity levels in Ireland and Northern Ireland.
The report found that “productivity levels in the two regions were broadly equivalent in 2000. Over the period 2001 to 2020, productivity levels in Ireland have trended slightly upwards, while in Northern Ireland productivity levels have been trending downwards. By 2020, productivity per worker was approximately 40 per cent higher in Ireland compared to Northern Ireland.”
The ESRI report’s authors took into account the distortionary impact of multinationals in Ireland. They found that Northern Ireland had a higher productivity in just two of the 17 sectors (electricity and gas supply; construction) that the ESRI report could find comparable data, with “particularly large [productivity] gaps [between Ireland and Northern Ireland] in administrative and support services activities; financial and insurance activities; legal and accounting activities etc; and scientific research and development.”
While different datasets need to be accessed and compared to get a view of productivity across UK regions and Ireland, there is plenty of evidence to indicate that Northern Ireland’s productivity is the lowest in the UK and much lower than in Ireland.
- Economic inactivity
The ONS Labour Force Survey defines someone to be ‘economically inactive’ if they are “aged 16 and over without a job who have not sought work in the last four weeks and/or are not available to start work in the next two weeks”. They are neither employed nor meet the criteria to be counted as unemployed.
The main economically inactive groups are “students, people looking after family and home, long-term sick and disabled, temporarily sick and disabled, retired people and discouraged workers”. The headline measure of inactivity for the UK is the ‘inactivity rate’ for those aged from 16 to 64.
Seasonally adjusted regional statistics are produced, splitting the UK into Northern Ireland, Scotland, Wales, and nine England regions. According to the latest statistical release (December 2022 to February 2023), Northern Ireland’s inactivity rate of 26.2% is the highest of any regions, well above Wales (second highest – 24.9%), North East of England (23.6%), West Midlands (22.7%), Scotland (22.0%), the English average (20.7%) and the UK average (21.1%).
CSO uses a slightly different measure for Ireland. It counts people from age 15 and upwards (with no ceiling). They also present their results in a different way to ONS and generally talk about the rise and fall in the number of people who are not in the labour market, rather than giving a percentage rate. However, the maths to do the conversion is straightforward.
The headline economic inactivity rate in Ireland is 35.4% (aged 15+) using the Q4 2202 statistics (1,473,300 out of 4,159,900 people were not in the labour force). Just under half the people deemed to be economically active in Ireland are aged 65 or older.
A better working age measure that can be compared with UK figures (aged 16-64) can be derived from CSO’s data portal and shows that the economically inactive rate in Ireland is 23.5% for people aged between 15-64 (794,400 persons not in labour force out of total population 3,378,400 in that age bracket) – which is well below the almost-equivalent figure for NI (26.2%).
It is accurate to say that Northern Ireland has the highest economic inactivity rate across the UK and Ireland.