- This estimate of costs comes from a major paper published by Ulster University.
- That 2016 report clearly outlines how it arrived at the £400m-£830m range of costs, including important points about its methodology.
- While it remains the most recent calculation of the cost to public services of NI’s divided society, the passage of time needs to be taken into account.
In its manifesto issued ahead of the 2023 local government elections, the Alliance Party claimed:
“The current estimates of the cost of division range between £400m and £830m annually.”
This claim is backed by evidence – however, that evidence comes with two major considerations:
- These numbers emerged from a series of calculations by academics at Ulster University. Several caveats accompanied these estimates, which were laid out clearly in the original research and the summary of its methodology.
- The paper that arrived at these numbers was published in 2016. Not only is seven years a significant amount of time in general but, more specifically, that period saw major economic and policy events, such as: Brexit; the pandemic; a changing security situation; and the inflation experienced over the course of recent years.
The UU paper remains the most up-to-date source for the cost of division to NI’s public services. However, it is important to put those figures in context, given the weight and scale of the considerations involved.
Study
This estimate comes from a 2016 study carried out by Ulster University’s Economic Policy Centre, on behalf of the Department of Finance.
Cost of Division used various estimates and analyses to compare the cost of public services in Northern Ireland to equivalent costs in other parts of the UK, and with Ireland. According to the report:
“On average, the cost of service delivery in Northern Ireland tends to be higher than the overall UK average. BUT across most areas, NI costs typically fall within the range of costs identified in other UK regions, albeit at the upper end.
“The one exception is policing, where average costs are significantly greater than all other comparable police forces in the UK and RoI.”
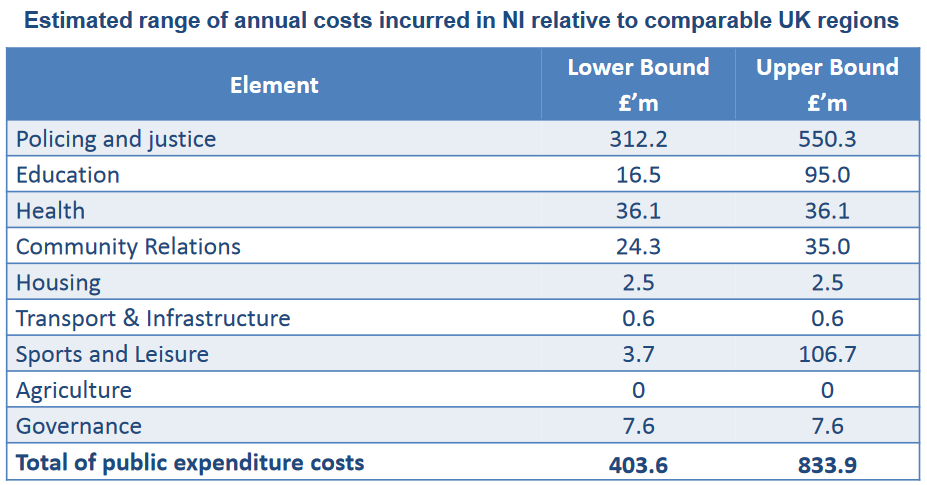
Figure 1 – source: Cost of Division, UU, 2016
The figure of approximately £400m to £830m per year is focused on public services specifically, and mainly reflects an estimate of excess costs on public sector provision – rather than all additional costs to society as a whole.
The Alliance Party’s claim was made in the correct context. It appeared in a section of their manifesto titled “Strengthening public trust and ensuring openness, transparency and value for money in all council operations”, which outlined how the party wants to provide efficient public services.
However, the UU figure itself does come with caveats. Some of these are set out in its own methodology – including that division might be one factor among several for certain costs (which contributed, in particular, to the use of upper and lower bounds for each cost) – and some exclusions including historic sunk costs, the social costs of division, and the costs to wider society (rather than just the public purse).
The estimated costs for different areas of public expenditure was also based on macro-level analysis, rather than a granular sift through individual needs assessments of NI in comparison with every other UK region (which the paper notes would be a huge undertaking).
A further point to note is the wide ranges involved with all these estimates. The £830m upper bound for the estimated cost of division is more than double the lower bound (£400m).
As well as the methodological considerations behind this estimate, there is another factor which is relevant to the accuracy of these figures: the passage of time.
Age
2016 is seven years ago, and a lot has happened since then – not least: Brexit; the pandemic; changes in the security situation; and significant spikes in inflation – that could cast doubt on the ongoing validity of the researchers’ estimate.
However, the Alliance Party is not alone in still citing these numbers. Indeed, Ulster University academics referenced the figures in a report published in April this year.
The Cost of Division in Northern Ireland is a briefing paper from UU’s Transforming Education series. Although this new report’s primary focus is on education, it also looks at the wider context of division.
The paper includes some context on how the figures in the 2016 report were calculated:
“In 2016, the Economic Policy Centre at Ulster University produced figures for the cost of division in NI. They too admitted that teasing out the costs that are due to division is challenging and, in relation to social costs for example, they concede that “division has created significant social issues and associated costs, but these have not been identified or quantified”. Also, they only considered data provided by others – they undertook no primary research themselves. Nonetheless, by comparing the costs for public services in NI with other similar regions of the UK, they produced an upper and a lower figure within which costs could at least partly be ascribed to division. This additional cost was calculated at between around £400 million and £830 million per year – over half of this attributed to policing and justice which is considerably more expensive in NI than elsewhere in the UK.”
Unlike this new UU study, the Alliance manifesto did not fully contextualise how the £400m to £830m estimate was calculated, nor did it summarise any caveats with its methodology.
However, manifestos are not research papers, and generally put more emphasis on accessibility and concision, rather than comprehensively listing supporting evidence.
Validity
In the absence of any fresher research, UU’s paper remains the most recent and succinct estimate of the cost of division to Northern Ireland’s public services.
Alliance’s manifesto described it as “current”, which is true in one sense and up for discussion in another. It is the most recent comprehensive study which makes a calculation of this kind and, as such, is the best ongoing estimate available.
On the other hand, calculations made seven years ago could perhaps helpfully be described as “most recent” rather than “current”, especially when the figures have not been adjusted for inflation (with significant rises over the subsequent seven years).
Overall, it is fair to say that this claim is backed by evidence, albeit with several weighty considerations that should be taken into account.