- These figures come from an internal report compiled by Ireland’s Department of Health, based on official figures from both north and south of the border.
- Over 281,000 people, per million people in NI, are on a waiting list for appointments, compared with 138,000 per million in Ireland.
- For those who have been waiting over 12 months, the disparity is even larger: 140,000 per million in NI, compared with 30,000 per million in Ireland.
An Irish Times article from 25 September claimed:
“Hospital waiting lists in Northern Ireland are twice as long as those in the Republic of Ireland, according to research by the Department of Health.
“Just more than 281,000 people per million are on a waiting list for appointments (inpatient and outpatient) in the North, compared to 138,000 per million in the South.
“The disparity is even greater among those who have waited more than 12 months for an appointment, with 140,000 people per million on the list in Northern Ireland, four times as many as the 30,000 waiting in the Republic.”
The news report said that these figures come from an internal report prepared by Ireland’s Department of Health (DoH), and obtained by the Irish Times via a Freedom of Information request.
FactCheckNI has reviewed this report and those figures reflect its content. The statistics it cites can be traced back to official numbers from both health services. The report has not been made available publicly, so we cannot link to it (although a screenshot of a relevant table is below).
Based on this data, the claim is accurate.
- Where did the figures come from?
FactCheckNI obtained a copy of the report by Ireland’s DoH.
North-South and East-West Waiting List Trends – Inpatient/Day Cases and Outpatients compares waiting lists in Ireland with Northern Ireland, as well as England, Scotland and Wales.
It details the total numbers of people on inpatient and outpatient waiting lists, and then calculates the length of the lists per million population. The same process is used for the total numbers of people waiting for more than a year.
Measuring the number of people per million population allows countries and regions of differing sizes to be compared.
The key figures are presented in this table:
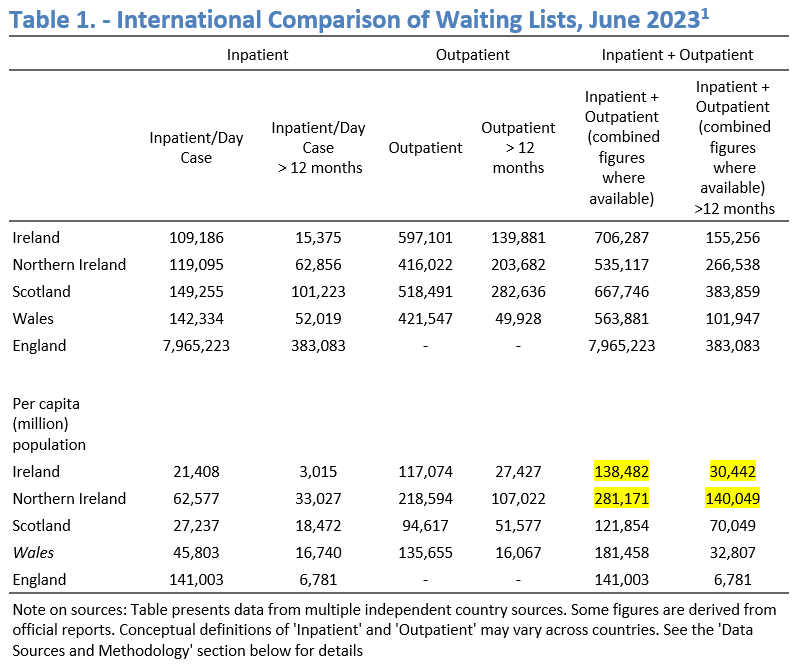
Figure 1 – source: research from Ireland’s Department of Health (yellow highlights added by FactCheckNI)
The table shows the total number of people waiting for inpatient and outpatient appointments, as well as those waiting for more than a year. It also breaks down those down by the number of people waiting per million population.
These figures from the original health department report match the story in the Irish Times. The only question left is whether the numbers in the original report are correct.
- Checking the raw data
The latest official figures for hospital waiting times in Northern Ireland were published in June by the NI Department of Health.
At that time, 119,095 people in total were waiting for inpatient or day care, of whom 62,856 had been waiting for over 52 weeks.
For outpatient care, 416,022 people were awaiting a first consultant-led appointment, of whom, 203,682 had been waiting more than 52 weeks.
The best estimate of Northern Ireland’s population available in June 2023 would have been the figure of 1,903,175 from the NISRA Census statistical bulletin published in November 2022.
Those figures match precisely the data in the report from Ireland’s DoH, which were then used to calculate the total waiting times per capita.
Ireland’s latest hospital waiting times are available on this Health Service Executive (HSE) dashboard, which is updated monthly. When this fact check was published in October 2023, the up-to-date figures on the dashboard were slightly different than those in the table above, but remain similar overall:
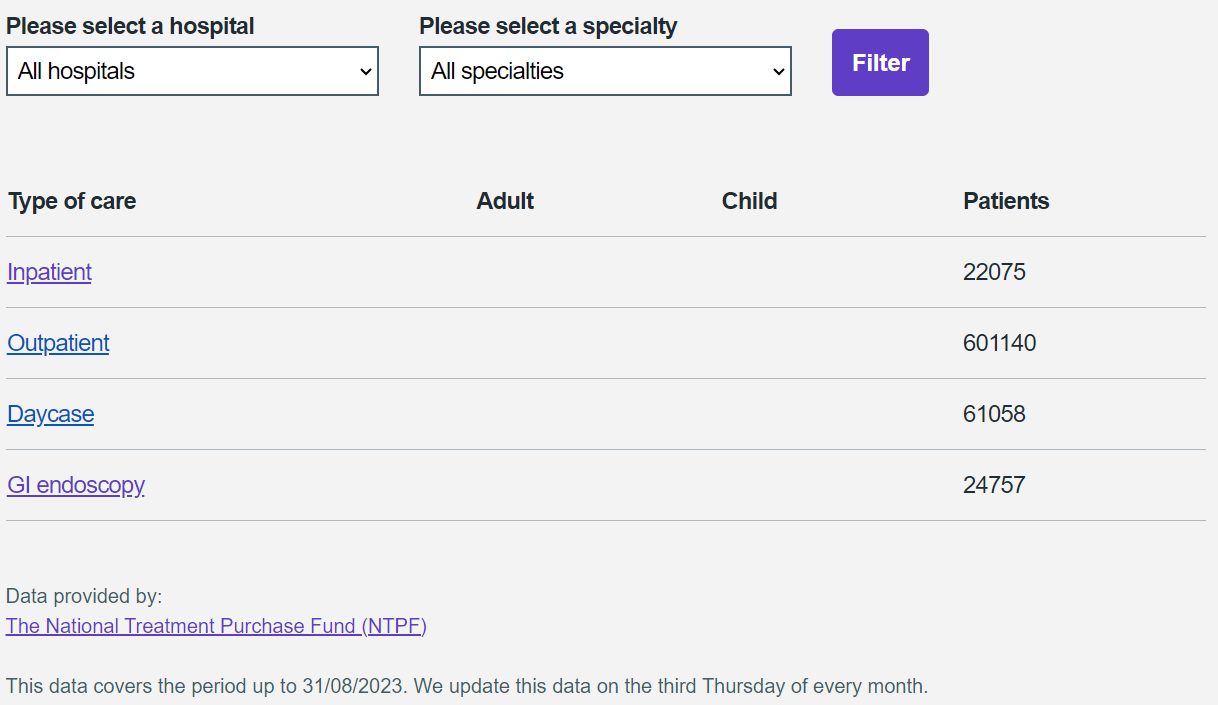
Figure 2 – source: HSE (note that “Inpatient/Data Case” data in figure one corresponds to inpatient + daycase + GI endoscopy numbers in this format)
The HSE gets its raw data from the National Treatment Purchase Fund, and also publishes monthly figures.