What are “excess deaths”, and how does the figure for Northern Ireland compare with elsewhere in the UK and across Europe?

[This explainer article is part of the COVID-19 Information Dissemination (COVID-19 ID) Project — a partnership between Community Development and Health Network (CDHN) and FactCheckNI. Its aim is to improve people’s health literacy about COVID-19 by providing accurate and up-to-date information, which will increase knowledge, understanding and confidence and enable people to make good health decisions.]
“Excess deaths” are defined as deaths during a given period that are greater than the usual number of deaths in similar historic time periods. Variations above or below the predicted average may indicate an event, for example a strain of influenza that resulted in more deaths than usual. For 2020, the most significant event associated with excess deaths is likely to be the presence of the novel coronavirus disease, COVID-19.
Excess death figures are a better measure across countries than counting deaths from COVID-19, due to the different ways that deaths associated with COVID-19 are counted. Alongside people counted in figures for those who tested positive for COVID-19 and subsequently died, other people die from COVID-19 symptoms without being tested for the disease. FactCheckNI has published articles about these different measures (1) (2) (3). Analysing all deaths takes into account indirect effects of the pandemic, such as deaths that may be related to changes in access to healthcare.
Cumulative excess deaths and COVID-19 related deaths in Northern Ireland
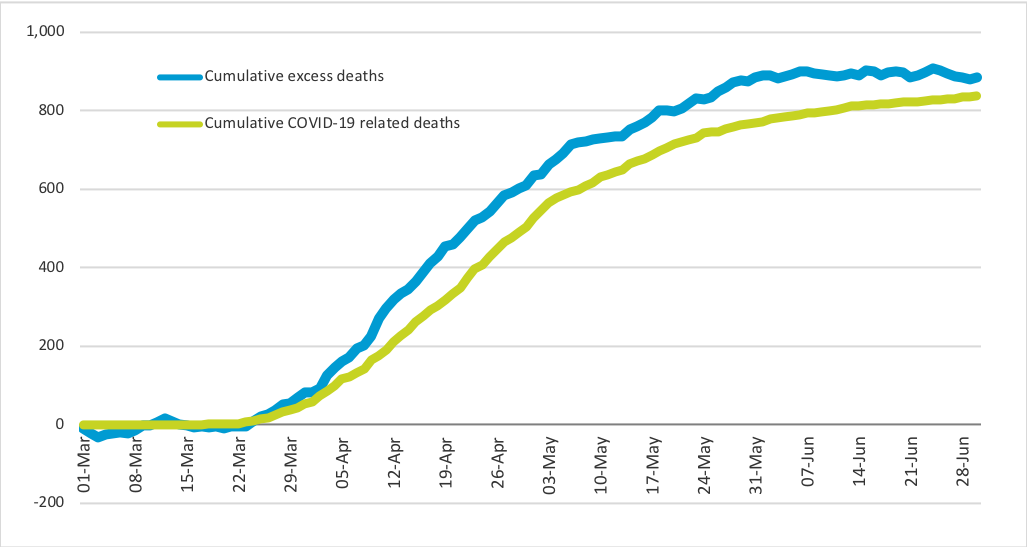
On 28 July 2020, the Northern Ireland Statistics and Research Agency (NISRA) published a bulletin that includes a chart of the cumulative number of excess deaths and COVID-19 related deaths in Northern Ireland between 1 March and 30 June 2020. Over this four month period, there were:
- 885 excess deaths; and
- 837 deaths with COVID-19 mentioned on the death certificate.
These figures and other analysis in the NISRA bulletin are based on the date when people died rather than when their death was formally registered. It includes data from the deaths registered up to 15 July 2020, to account for any time lag between occurrence and registration of death.
Chart: Cumulative number of excess deaths and COVID-19 related deaths, 1 March to 30 June 2020
Excess deaths can be calculated for various demographics, including age and sex.
In Northern Ireland, both excess deaths and COVID-19 related deaths increase with age. Excess deaths for the age group 55-64 years (95) were more than double that of COVID-19 related deaths (40). NISRA suggests that “direct effects of the pandemic could account for less than half of the impact on excess mortality in this age group”.
Are excess deaths uniform across place of death in Northern Ireland?
Over the four month period, the NISRA report shows a negative (or lesser) excess death figure in hospitals (-88) and a higher figure of excess deaths at home (556). This is in contrast to the figures for COVID-19 related deaths in hospitals (434) and at home (44).
Chart: Northern Ireland excess deaths and COVID-19 related deaths, by place of death, from 1 March to 30 June 2020
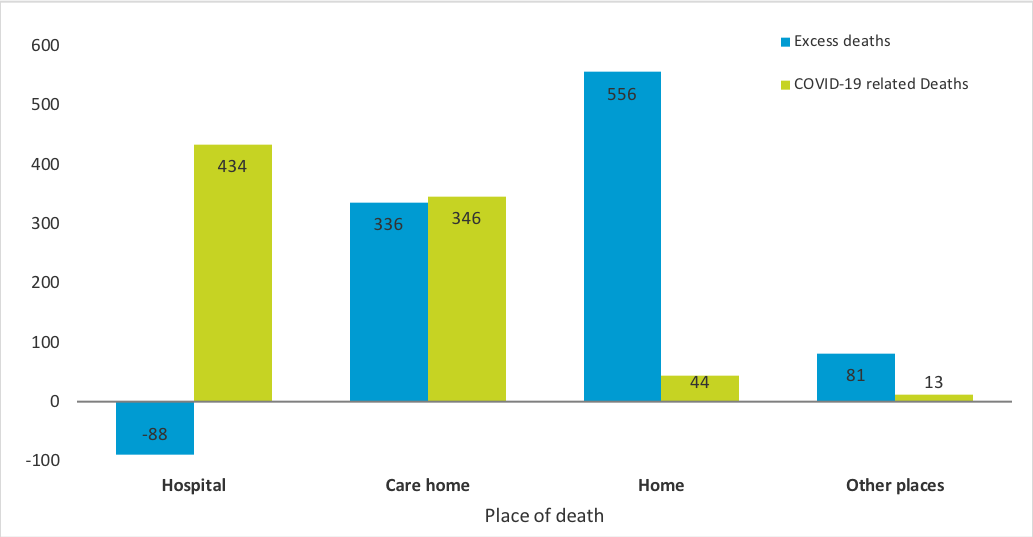
NISRA suggests that this might be partly explained by hospitals retaining capacity for COVID-19 patients as well as restrictions on hospital visitors, leading some patients to decide to receive palliative care at home. At care homes, the figures for excess deaths (336) and COVID-19 related deaths (346) are similar.
NISRA states that during this period, total deaths in care homes were 32.1% higher than the average over the past five years. The following chart shows excess deaths and COVID-19 related deaths, by place of death, from 1 March to 30 June 2020.
How does Northern Ireland compare with the rest of the UK?
Weekly data on deaths for 2020 and past years are available for England, Wales, Scotland, and Northern Ireland. For the 2020 pandemic event, comparing against the average deaths from 2015-2019, all four countries show a similar sharp increase in the number of excess deaths, followed by a decrease towards no excess deaths. This is illustrated by the following chart, based on dates of registration of deaths, which plots weekly excess deaths for the year 2020, per million of the country’s population; FactCheckNI used mid-2019 population estimates.
Chart: Weekly excess deaths per million of UK country population (2020), calendar weeks 1-28 (ending 19/7/2020)
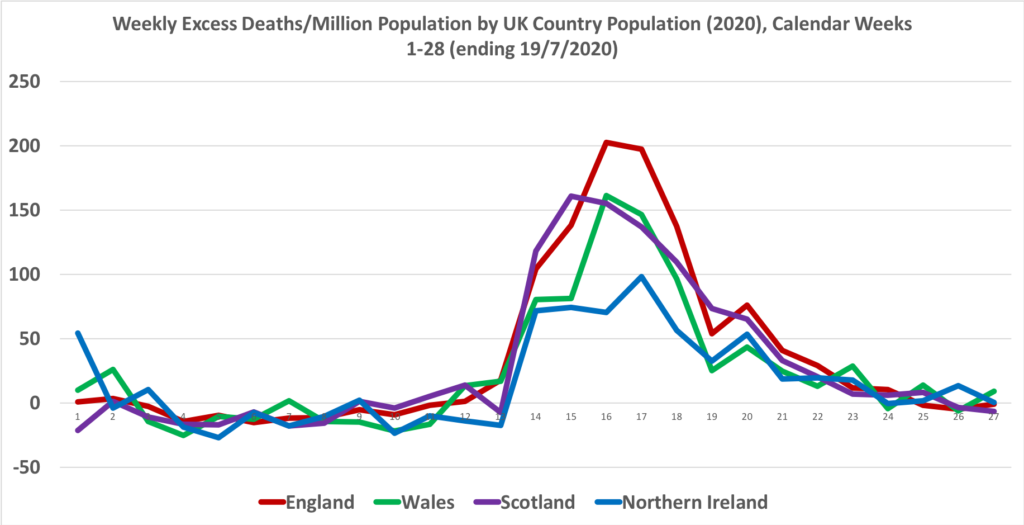
Over an 11-week period that covers the worst weeks of the pandemic—calendar weeks 13–23—England recorded the highest figure of excess deaths. By standardising per million population, the following table shows relative figures of excess deaths during this 11-week period, by country.
Table: Excess Deaths from Week 13-23 by UK Country per Million Population
| Country | Excess Deaths | Excess Deaths/Million Population |
| England | 55,775 | 991 |
| Wales | 2,211 | 701 |
| Scotland | 4,808 | 880 |
| Northern Ireland | 973 | 514 |
Sources: Office for National Statistics (England and Wales); National Records of Scotland (Scotland); and the Northern Ireland Statistics and Research Agency (Northern Ireland).
The table suggests that England had the highest figure (991) for excess deaths per million of the population of the country, while Northern Ireland had the lowest figure (514) per million of its population.
How does the UK compare with elsewhere in Europe?
Comparable official excess death statistics for the Republic of Ireland are not yet available. However, the Irish Health Information and Quality Authority’s (HIQA) Chief Scientist, Dr Conor Teljeur, commented on 6 July 2020: “Based on an analysis of the death notices reported on RIP.ie since 2010, there is clear evidence of excess deaths occurring since the first reported death due to Covid-19 in Ireland. There were about 1,100 to 1,200 more deaths than we would expect based on historical patterns; a 13% increase between 11 March to 16 June. However, the number of excess deaths is substantially less than the reported 1,709 Covid-19-related deaths over the same period.” If these estimated figures prove accurate, the excess deaths in Ireland were running at a level below that of Northern Ireland, Wales, Scotland and England.
The Health Foundation provides a comparable table of excess deaths per million of the population of several other European countries, for an 11-week period covering the worst weeks of the pandemic. It is important to note that the start and end weeks vary among the countries.
Table: Excess Deaths from Week 13-23 by European Country per Million Population
| Country | Excess Deaths | Excess Deaths/Million Population | Start-End Weeks |
| France | 25,285 | 377 | 11-21 |
| Germany | 7,300 | 88 | 11-21 |
| Italy | 44,866 | 743 | 9-19 |
| Spain | 48,399 | 1,023 | 11-21 |
| Sweden | 5,080 | 497 | 13-23 |
| UK | 64,451 | 965 | 13-23 |
Source: The Health Foundation
The table suggests that different countries had different experiences in managing the pandemic during the peak of the “first wave”, or surge, of infection. There is a notable variance between the lowest figure (88) for excess deaths per million of the population in Germany and the highest in Spain (1,023). The corresponding figure for the UK (965) is the second highest in the table of listed countries.
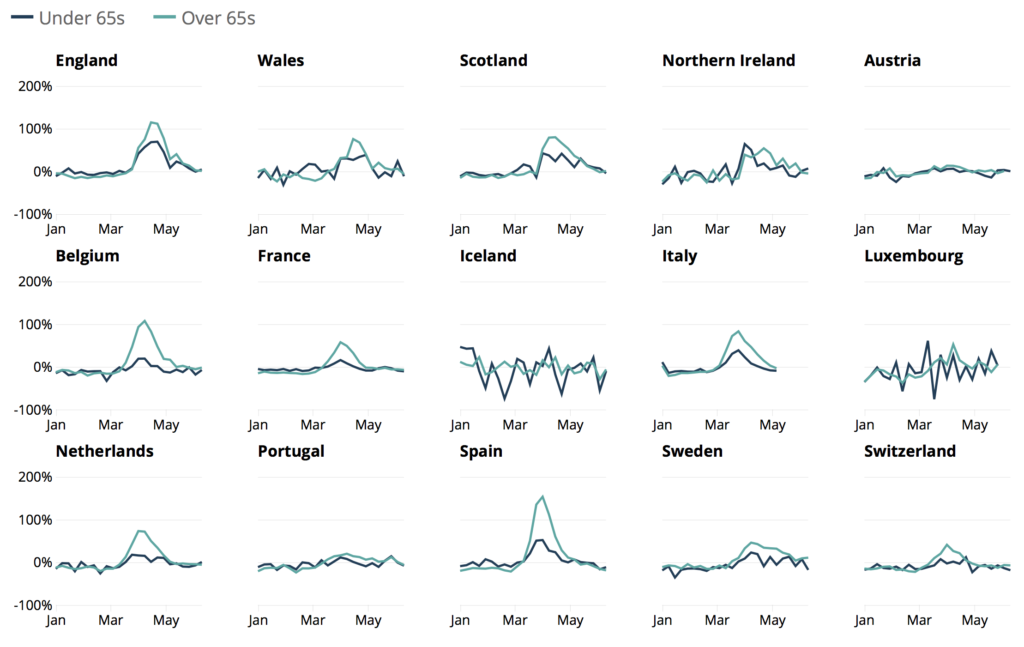
The ONS published a report that compares mortality across Europe, using data compiled by Eurostat. The report contains excess deaths figures expressed as a percentage rate, where the axis represents the expected mortality rate (previous five year average), and a value of 100% represents a mortality rate 100% higher than, or double, the five year average. The chart below shows mortality rates within the UK and selected European countries, for the period 3 January to 12 June 2020.
Chart: Relative age-standardised mortality rates, Week 1 (week ending 3 January) to Week 24 (week ending 12 June), selected European countries
There is also an interactive map (Figure 3) that shows these rates by week and region of Europe:
What will be the total excess deaths associated with COVID-19?
As was the case during the first wave of the pandemic, several circumstances will affect the figures for both absolute deaths and relative excess deaths associated with COVID-19:
- how quickly an outbreak spreads before identification (track and trace systems);
- the quality and adherence to intervention policies (e.g. lockdown, social distancing, PPE, testing);
- the demography of the population, especially for those more at risk (e.g. levels of obesity, those with existing comorbidity conditions);
- the quality of health care for those with COVID-19; and
- the quality of health care for those without COVID-19.
NISRA will release their next regular report on causes of death based on death registration coding on 17 September 2020, which may shed more light on changes of proportions of causes of deaths between 2020 and previous years. The level of immunity for those who have survived infection along with any possible future vaccination programme may need to be factored into analysis. In summary, a final excess death figure for this specific COVID-19 event cannot be predicted.
FactCheckNI is Northern Ireland’s first and only dedicated independent fact-checking service and a verified signatory to the International Fact-Checking Network’s Code of Principles. You can learn more about about FactCheckNI, our personnel, what our article verdicts mean, and how to submit a claim.